This is a lovely video story, from Vi Hart's Site . How quickly do you get the point, or do you have to wait for the end?
It is fun to play with moebius strips, but if you haven't got the time to make one and test what happens when you cut it in two (as happens at the end of the story) then the video below provides the answer, along with some other interesting properties of moebius strips.
So will Wind see her dog again? The answer is a bit tricky! Answers in the comments.
Escher used the idea of Moebius Strips in some of his designs; the one below is one of his most famous pieces.
This video is another great variation of a Möbius Strip theme.
Vi Hart is obviously a Harry Potter fan. She composed a seven movement musical tribute the the Harry Potter Series, called the Harry Potter Septet. Here is a video, from the Septet, of a of a song that uses Ginny Weasley's singing valentine from the Chamber of Secrets.
Nobel Prize winner Sir Paul Nurse, who is also President of the Royal Society, investigates this issue in the horizon documentary below.
This is a fairly gentle response which comes to the conclusion that scientists have to be more active in explaining and defending their work from those who would attack it. This is fair enough, though I wonder if Nurse would be so calm and measured if the likes of Singer and Delingpole came after his work in the dishonest and deceitful way that they attack the climate scientists. My suspicion is that he would take the sort of strong defense shown by Ben Santer in this post.
The Videos in this post constitute a documentary based on Jared Diamond's book Guns, Germs and Steel. I recommend that anyone interested in World History read the 450 pages of the book - these videos give an excellent introduction to the main themes of the book.
Episode One : Out of Eden
Jared Diamond's journey of discovery began on the island of Papua New Guinea. There, in 1974, a local named Yali asked Diamond a deceptively simple question:
"Why is it that you white people developed so much cargo, but we black people had little cargo of our own?"
Diamond realized that Yali's question penetrated the heart of a great mystery of human history -- the roots of global inequality.
Why were Europeans the ones with all the cargo? Why had they taken over so much of the world, instead of the native people of New Guinea? How did Europeans end up with what Diamond terms the agents of conquest: guns, germs and steel? It was these agents of conquest that allowed 168 Spanish conquistadors to defeat an Imperial Inca army of 80,000 in 1532, and set a pattern of European conquest which would continue right up to the present day.
Diamond knew that the answer had little to do with ingenuity or individual skill. From his own experience in the jungles of New Guinea, he had observed that native hunter-gatherers were just as intelligent as people of European descent -- and far more resourceful. Their lives were tough, and it seemed a terrible paradox of history that these extraordinary people should be the conquered, and not the conquerors.
To examine the reasons for European success, Jared realized he had to peel back the layers of history and begin his search at a time of equality -- a time when all the peoples of the world lived in exactly the same way.
Episode Two : Conquest
On November 15th 1532, 168 Spanish conquistadors arrive in the holy city of Cajamarca, at the heart of the Inca Empire, in Peru.
They are exhausted, outnumbered and terrified -- ahead of them are camped 80,000 Inca troops and the entourage of the Emperor himself.
Yet, within just 24 hours, more than 7,000 Inca warriors lie slaughtered; the Emperor languishes in chains; and the victorious Europeans begin a reign of colonial terror which will sweep through the entire American continent.
Why was the balance of power so unequal between the Old World, and the New?
Episode Three : Into the Tropics
So far, Jared Diamond has demonstrated how geography favoured one group of people -- Europeans -- endowing them with agents of conquest ahead of their rivals around the world. Guns, germs and steel allowed Europeans to colonize vast tracts of the globe -- but what happened when this all-conquering package arrived in Africa, the birthplace of humanity?
Can Jared Diamond's theories explain how a continent so rich in natural resources, could have ended up the poorest continent on earth?
Can Jared Diamond explain how America fell to guns, germs and steel?
The point of the book is best described by its subtitle: How Societies Choose to Fail or Survive.
It would take days or even weeks to read the 560 pages of the book, but in only an hour, Diamond provides an effective summary in the video below.
Diamond developed a five point framework for considering the fate of societies. The following paragraph, taken from page 11 of the book, briefly describes the factors:
... I don't know of any case in which a societie's collapse can be attributed solely to environmental damage: there are always other contributing factors. When I began to plan this book, I didn't appreciate those complications, and I naively thought that the book would just be about enviromental damage. Eventually, I arrived at a five-point framework of possible contributing factors that I now consider in trying to understand any putative environmental collapse. Four of those sets of factors - environmental damage, climate change, hostile neighbors, and friendly trade partners - may or may not prove significant for a particular society. The fifth set of factors - the society's response to its environmental problems - always proves significant.
Here are my thoughts and summary of the talk. The video can be found at the bottom of the post.
Morris starts with an apposite quote from Winston Churchill: "The farther backward you can look the farther forward you are likely to see."
Three kinds of things to know before answering the question, "Why the West Rules - For Now:
1. Biology - the study of what we are. Human Beings are all much the same, where ever you find them. 2. Sociology - similarities and differences between societies: why societies innovate and respond effectively to crises and why they sometimes don't.
These two issues help to provide a general theory of human history, about all people in all times and all places. But it is not enough to tell us why the West Rules for that you need:
3. Geography - but it gives an answer in complicated ways. Geography drives the development of societies but on the other hand, the development of societies drives what geography means. Simply put, geography drives the current distribution of wealtha and power. Agriculture (which was essential to civilisation) could only develop initially where there existed concentrations of domesticable plants and animals - ie a geographical effect. The place where these creatures were most densely concentrated was in the Fertile Crescent (in the current Middle East) so that is where agriculture first appeared, followed a few thousand years later by East Asia (China), the Indus Valley (Pakistan) and the Americas. As societies developed, based on agriculture, the meaning of geography changed, initially access to great rivers was very important which led to the great civilisations on Mesopotamia, and then access to seas - the classical European civilisations developed around the Mediterranean.
So far this is fairly familiar to readers of Jarred Diamond's books, Guns, Germs and Steel and Collapse which is why I find the presentation compelling. The section of Diamond's Guns ... was his explanation of why Western Europe develped much more quickly than it main competitor, China, after about 1400. Ian Morris provides an interesting explanation, embedded in his geographical theme - that European development was driven by the discovery of the Americas, and that the Americas were twice as close to Europe as to East Asia. Before Europeans had ships that could safely traverse the Atlantic Ocean, this fact of geography was not important, but once they has such ships the meaning of geography had been changed by the new technology. This change of technology set up a cascade of new effects - in the fields of economics, the natural sciences, technology and mathematics.
So what about the future?
Great trends can help us predict future developments, but historical analysis also shows that the great trends of history have steadily developed forces that undermine them.
Projecting forward: the East will catch up the West early after 2100, assuming that rates of change will occur at 20th century changes. If changes occur more quickly (as is likely) then the East will castch up during the second half of this century. Morris predicts extremely rapid change in Social Development. Morris's description of a utipian future left me somewhat disturbed until he started discussing the counter point: that trends constantly generate the trends that undermine them. The same set of problems come up when civilizations collapse are familiar today: uncontrolled migration, failure of state organisatins, famine, epidemic disease, and climate change.
One of the most disappointing aspects of popular discussion of current events is the lack of a historical context, talks like this put our current predicament in a broad context - 15,000 years!
One of the many indicators that the planet is warming dangerously is the state of the sea ice. Here and here are two of my articles on the Arctic Sea Ice. The argument can be made that just because there are problems with sea ice in one part of the world that doesn't mean that there is a global problem.
Lord Monckton tries to make that point in the graphic below, which is taken from a power point presentation found here.
Monckton claims that "Global sea ice extent shows little trend for 30 years". The graph to notice is the red line at the bottom, the Sea Ice Anomaly. (An anomaly is a variation from average values, which is useful in determining trends in data.) A casual perusal of that line might indicate only a small amount of change. Those who are familiar with Monckton might expect that he has manipulated the graph in some way to make it look as if there has been little change, after all Monckton has form in misrepresenting climate science. In reality the graph is taken directly from The Cryosphere Today site at this link. The problem is with the format of the graph. The Y-axis has a range of 27, while the data has a range of about 3. Formatting the chart this way has the effect of squashing the graph, and so making any trends less obvious. (Incidentally, Cryosphere Today did not attempt to manipulate the presentation of the data, they chose that format so that the anomaly and the area values could be shown on the same graph.)
If we are going to get a clear view of the the changes in the anomaly then we should plot the data with y-axis values that are similar to the range of the data. I have done that in the chart reproduced below.
Before discussing this graph, I will describe how I produced it. The source for the data, which I saved as global_sea_ice.csv is found here at The Cryosphere Today site. My program, written in R, to plot the data can be found in the appendix.
The red line in the chart is the anomaly data, the black line is the linear trend line. The data is quite noisy (variable) and although the anomaly at the moment is below zero (ie is less than the 30 year average) sometime in the next few years it will climb above zero and then some crazy will claim that Global Sea Ice is not declining. The one thing that is eminently clear is that the trend Global Sea Ice is declining, and the trend is the most important issue, not the current value of the anomaly.
It is amazing that Monckton's nonsense can be so easily taken to pieces, after all he has a huge public profile.
I decided to check the data and perform my own analysis after reading this post at Tamino's Site. I did not do this analysis because I thought Tamino might be wrong, that was not likely, but because Tamino invited his readers to do their own analysis. I was pleased to see that my result was the same as Tamino's.
Appendix
#################### Global Sea Ice Anomaly #################
##### Written by Stephen Spencer 19/01/2011 ##########
From the title of this post you might expect that I will be discussing Sarah Palin or Andrew Bolt, but this is not the case.
At this link you will find a very interesting article, written by Akim Reinhardt, which includes the following:
I study the past. It’s what I do for a living. Like any historian, I strive to understand the past in a historical context and on its own terms. But as a human being, I inevitably use my own presentist sense of morality and ethics when passing judgment on it. And here’s the thing. Slavery and genocides, those are easy for us now. Yeah, super wrong, we get it. But who would you have been back then, in the moment? We all want to believe that we would have been the person working to free slaves through the underground railroad, or living peaceably with Indians, or smuggling Jews out of Europe. But guess what? You wouldn’t have. Or at least, it’s not very likely. No, odds are, you would’ve been some douche bag who justified it with mealy mouthed excuses, or laid low and avoided talking about such unpleasantness. Why? I’ll tell you why. Because when crazy shit is the norm, the lunatic fringe are the ones who embrace the right choice. If crazy is normal, then the right answer seems crazy. I’ll say it again. If crazy is the norm, then opposing it seems crazy.
Are you crazy? Are you John Brown on the fringe? I mean really on the fringe.
Reinhardt in discussing slavery makes the point that from the perspective of our current morality such an institution is outrageous, that is, we are all abolitionists. But, that does not mean that the historical abolitionists had views that were similar to us. We reject slavery because it is racist, but 19th century abolitionists accepted the view then current that the slaves were inferior, their objections were on religious grounds.
Reinhardt then discusses the immorality of meat eating. His claim is that just as we judge those in the past for their support for or acquiescence in slavery, so descendents, possibly centuries in the future, will be judging us on our barbaric practice of meat eating. Maybe ... anyway read the article, it is a good read.
What concerns me that in a few decades (not centuries) my generation will be judged by our grand children or great grand children. I expect the question, sometimes in the 2030s, "Grandpa, it was obvious more than 20 years ago that we were heading to the end of the fossil fuel era, and yet your generation did nothing to prepare for it."
Before considering the views of Climate Scientists the following video from the US ABC is a useful introduction:
Summary of Expert Opinion
This is a complex issue, so what do climate experts have to say about it?
Here is my summary of the points made by the experts.
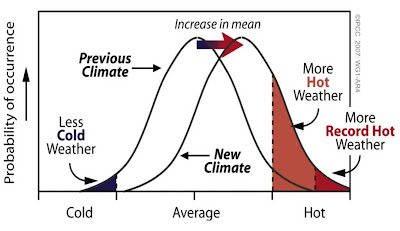
1. The probability of the occurrance of extreme events will change most as they are in the tail of the probability distribution.
The diagram below helps to make this important concept clear. The diagram is referring to temperature events, but could just as easily involve hydrological events, such as droughts or floods. The probabilities of many events can be described in terms of the bell shaped normal curve. The diagram shows two normal curves, which have different means (averages). Note with the left (cooler) curve the very hot temperatures (marked in dark red) are very unlikely but if the mean temperature is increased (the right curve) the very hot temperatures become much more likely.
2. the extra warming increases the amount of water vapour in the atmosphere which invigorates storms, and generally makes the hydrological (water) cycle more active.
3. the extra warming also leads to hotter weather.
4. although it is often stated that it is impossible to attribute individual weather events to global warming, scientists are developing methods of determining the degree to which global warming caused specific events (“fractional attributable risk”). One such study Stott et al that can be read at this link, concluded:
Using a threshold for mean summer temperature that was exceeded in 2003, but in no other year since the start of the instrumental record in 1851, we estimate it is very likely (confidence level >90%)that human influence has at least doubled the risk of a heatwave exceeding this threshold magnitude.
The complexity of these issues, and the degree to which they can be easily misrepresented is illustrated in this post on Tropical Cyclomes.
If the scientists are right and our warming of the planet is partly to blame for increased extreme weather, of particular concern is that we have only had 3/40C of warming so far. What will the world be like when we have had 20C of warming?
The Experts Speak for Themselves
The UK MET Office and the Royal Society released a joint statement in 2009, which can be found at this link. The whole report is worth reading, but here is the section that refers to extreme weather events:
We expect some of the most significant impacts of climate change to occur when natural variability is exacerbated by long-term global warming, so that even small changes in global temperatures can produce damaging local and regional effects. Year on year the evidence is growing that damaging climate and weather events - potentially intensified by global warming - are already happening and beginning to affect society and ecosystems. This includes:
* In the UK, heavier daily rainfall leading to local flooding such as in the summer of 2007;
* Increased risk of summer heat waves such as the summers of 2003 across the UK and Europe;
* Around the world, increasing incidence of extreme weather events with unprecedented levels of damage to society and infrastructure. This year's unusually destructive typhoon season in South East Asia, while not easy to attribute directly to climate change, illustrates the vulnerabilities to such events;
* Sea level rises leading to dangerous exposure of populations in, for example, Bangladesh, the Maldives and other island states;
* Persistent droughts, leading to pressures on water and food resources, and the increasing incidence of forest fires in regions where future projections indicate long term reductions in rainfall, such as South West Australia and the Mediterranean.
These emerging signals are consistent with what we expect from our projections, giving us confidence in the science and models that underpin them. In the absence of action to mitigate climate change, we can expect much larger changes in the coming decades than have been seen so
Here are the views of three prominent climate scientists in their own words.
According to James Hanson at this link, the language used by experts is often confusing to the general public:
Was global warming the cause of the 2010 heat wave in Moscow, the 2003 heat wave in Europe, the all-time record high temperatures reached in many Asian nations in 2010, the incredible Pakistan flood in 2010? The standard scientist answer is “you cannot blame a specific weather/climate event on global warming.” That answer, to the public, translates as “no”.
However, if the question were posed as “would these events have occurred if atmospheric carbon dioxide had remained at its pre-industrial level of 280 ppm?”, an appropriate answer in that case is “almost certainly not.” That answer, to the public, translates as “yes”, i.e., humans probably bear a responsibility for the extreme event.
In either case, the scientist usually goes on to say something about probabilities and how those are changing because of global warming. But the extended discussion, to much of the public, is chatter. The initial answer is all important.
Although either answer can be defended as “correct”, we suggest that leading with the standard caveat “you cannot blame…” is misleading and allows a misinterpretation about the danger of increasing extreme events. Extreme events, by definition, are on the tail of the probability distribution. Events in the tail of the distribution are the ones that change most in frequency of occurrence as the distribution shifts due to global warming.
For example, the “hundred year flood” was once something that you had better be aware of, but it was not very likely soon and you could get reasonably priced insurance. But the probability distribution function does not need to shift very far for the 100-year event to be occurring several times a century, along with a good chance of at least one 500-year event.
Kevin Trenberth (KT) in an inteview with Joe Rohmm (JR) at this link, gave the following opinion:
JR: It seems to me the media hasn’t figured out a way to talk about this so they often just don’t talk about it at all.
KT: That’s correct.
JR: And as a result the public never learns the connection to climate change. I’m just wondering if you have any comments about that and what you would suggest is the right way to talk about it and the like.
KT: I find it systematically tends to get underplayed and it often gets underplayed by my fellow scientists. Because one of the opening statements, which I’m sure you’ve probably heard is “Well you can’t attribute a single event to climate change.” But there is a systematic influence on all of these weather events now-a-days because of the fact that there is this extra water vapor lurking around in the atmosphere than there used to be say 30 years ago. It’s about a 4% extra amount, it invigorates the storms, it provides plenty of moisture for these storms and it’s unfortunate that the public is not associating these with the fact that this is one manifestation of climate change. And the prospects are that these kinds of things will only get bigger and worse in the future.
Also in the interview Trenberth discusses hard evidence that extreme events were increasing:
... there was a study a few years ago now, that only went through 2002 but it was looking at the 20th century and at that point the average rainfall over the 48 contiguous states had gone up 7% but the heavy rainfall events had gone up 20%. And so the heavy rainfall events have been documented as increasing across the United States.
... There was a more recent study that looked at somewhat different statistics and showed that the really heavy rainfall events — the top 1% and the top 0.3% — had gone up at even more alarming levels something like 27% as I recall over the last 30 or 40 years [actually 1967 to 2006]. And indeed most of those changes have occurred since about 1970.
There was a more recent study that looked at somewhat different statistics and showed that the really heavy rainfall events — the top 1% and the top 0.3% — had gone up at even more alarming levels something like 27% as I recall over the last 30 or 40 years [actually 1967 to 2006]. And indeed most of those changes have occurred since about 1970.
In the video below, Ben Santer makes some of the points already introduced by Hansen and Trenberth, but also discusses some new work on determining the liklehood of extreme events using the fractional attributable risk method found in other disciplines. His final point is also important: it is not surprising that we are getting extreme weather events as we warm up the planet.
We are now capable of making informed scientific statements regarding the influence of human activities on the likelihood of extreme events (75, 76, 77).
As noted previously, computer models can be used to perform the control experiment (no human effects on climate) that we cannot perform in the real world. Using the “unforced” climate variability from a multi-century control run, it is possible to determine how many times an extreme event of a given magnitude should have been observed in the absence of human interference. The probability of obtaining the same extreme event is then calculated in a perturbed climate – for example, in a model experiment with historical or future increases in greenhouse gases, or under some specified change in mean climate (78). Comparison of the frequencies of extremes in the control and perturbed experiments allows climate scientists to make probabilistic statements about how human-induced climate change may have altered the likelihood of the extreme event (53, 78, 79). This is sometimes referred to as an assessment of “fractional attributable risk” (78).
Recently, a “fractional attributable risk” study of the 2003 European summer heat wave concluded that “there is a greater than 90% chance that over half the risk of European summer temperatures exceeding a threshold of 1.6 K is attributable to human influence on climate” (78).
This study (and related work) illustrates that the “D&A” [detection and attribution] community has moved beyond analysis of changes in the mean state of the climate. We now apply rigorous statistical methods to the problem of estimating how human activities may alter the probability of occurrence extreme events. The demonstration of human culpability in changing these risks is likely to have significant implications for the debate on policy responses to climate change.
(Note that the numbers in brackets refer to peer reviewed publications. The details of the publications can be found in the document at the link above.)
Will Steffen is one of Australia's premier climate scientists. That he agrees that global warming will increase the probability of extreme events can be found at this link.